Understanding student performance management with analytics
Monitoring Virtual Attendance in Your Schools During the COVID Era

As schools fluctuate from in-person to online class and everything in between, attendance has new and varied definitions. Leaders are challenged to understand what is happening and where to focus their time. Your data can help.

Assess the Reality
When it comes to attendance these days, you get a different answer depending on who you talk to. While surveying our customers the answers go all the way from “We are in class every day and attendance is normal” to “We are all virtual and some teachers hold class on Zoom, some on Google and some not at all. Attendance could be a combination of online participation, assignment submission, or even just logging in. The teachers enter it.” Usually, that statement, made over a virtual meeting, is followed by a long pause while everyone ponders what it means.
Many schools are closer to the second scenario, and be it all virtual or hybrid, will probably continue that way through the end of the year.
How can school administrators subjectively know where they stand with attendance? With data, of course.
Follow the Data
For the most part, the student information system (SIS) remains the system of record for attendance. However in this “virtual reality”, what constitutes attendance is sometimes a complicated formula and often a judgment call. Teachers are overwhelmed and it is everything many can do just to teach the kids they know are engaged. It’s no wonder when you step back and look at attendance data, it’s all over the map. Take, for example, the following chart which plots overall school-level attendance rates for the prior 2 years and the current year.
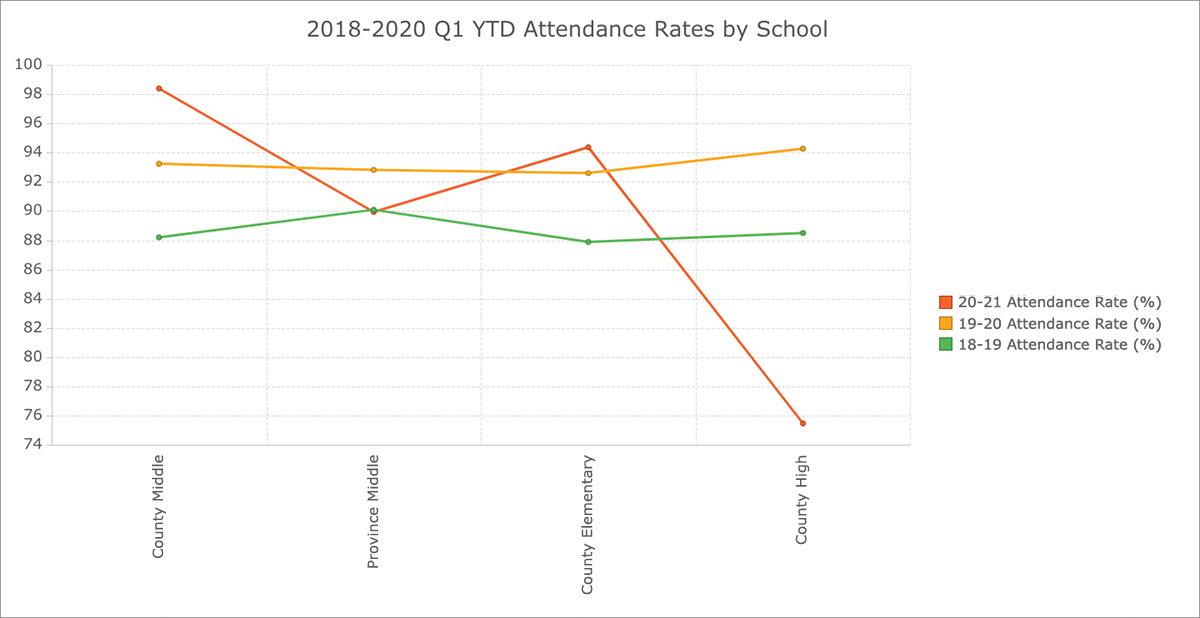
Generally one might expect the 20-21 line to follow the pattern of the prior 2 years with maybe a somewhat lower level of attendance due to virtual. But here, with just four schools in play, you see a wide variation of attendance rates from much worse to about the same to much better. What’s going on here? Hard to say but at least it tells you something is amiss somewhere. It’s time to dig deeper.
Dig Deeper: Attendance for Student Groups
What if we start looking at certain groups of students in those schools, for example, students with disabilities?
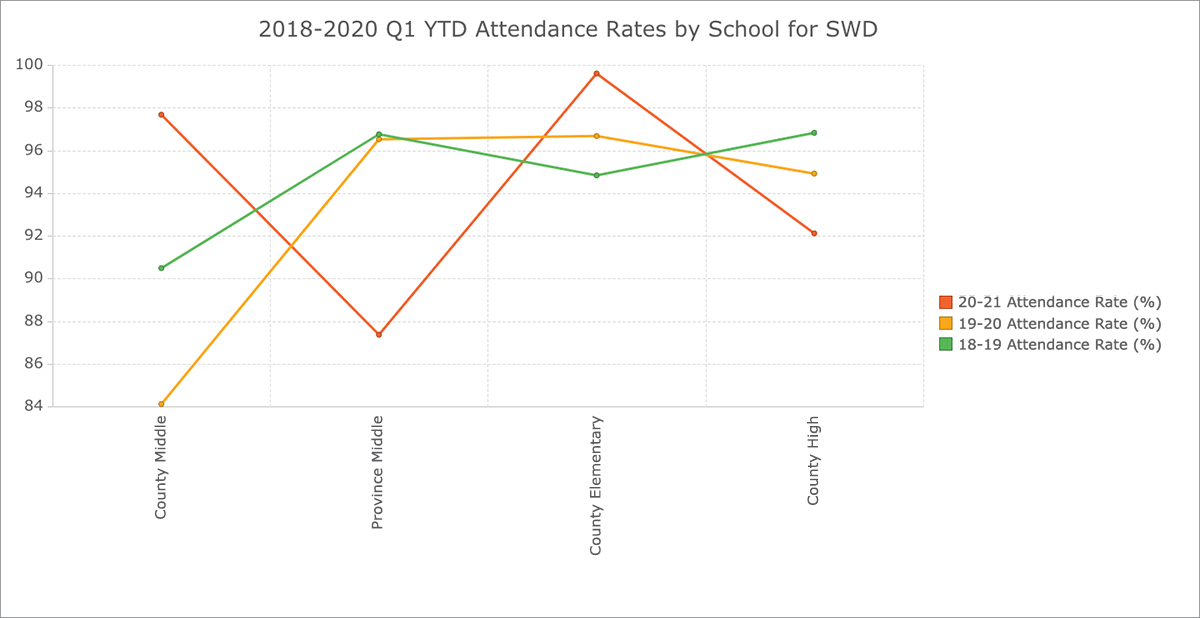
In some school systems, students with disabilities are the only kids that regularly attend in person right now. Even if that’s the case here, at least 2 of the schools have some attendance rates for this student group that require more scrutiny. While overall attendance may look normal, certain student populations appear to be suffering disproportionately, as is the case with the students with disabilities at Province Middle. On the other hand, they are doing much better at County Middle compared to prior years. Understanding the cause for such divergence might be a good next step.
Follow Up and Follow Through
Your data analytics or SIS should produce this sort of analysis on demand and in just a couple minutes. This means taking a snapshot of your data, implementing changes on the ground, and then following up with the latest data. Here your time is best spent on school team interactions, not conjuring up data – or tasking your IT staff to do the same. The point is to focus your attention on the follow-through with the people involved and confirming progress through facts represented by enabling and widely available data.
Is it difficult (or impossible) to easily produce and reproduce the transparent analysis necessary to manage virtual attendance? We can solve that part. Drop us a line.