Understanding Data Automation with Integrator
Analyzing job data and changes in Integrator
While data automation is at it’s best when you don’t have to think about it, occasionally you’ll want to see what’s going on. One of the most common activities performed in Integrator is data analysis, especially for change data.
Why analyze job data?
The most common data analysis scenario in Integrator is when you are reacting to a Safeguard hold placed on a recent job due to the level of changes found. Other reasons include user inquiry about data in their apps; verifying agent configuration changes are working; data quality audit; or just occasional monitoring to see what’s been happening in the data. No matter what the reason is, your path to analysis is the same and it will often take just a few minutes to conduct.
Analyzing job data: Step-by-Step
Most of the time, you are looking at the data from the last job to answer a specific question and this is how it’s done.
1. Login to your Integrator portal at https://dis.readwritedigital.com/. You will immediately see your “Jobs” dashboard listing your agents and their most recent jobs. You may have one agent or one-hundred but you’ll generally see something like the following list of 4 agents and their associated job data:
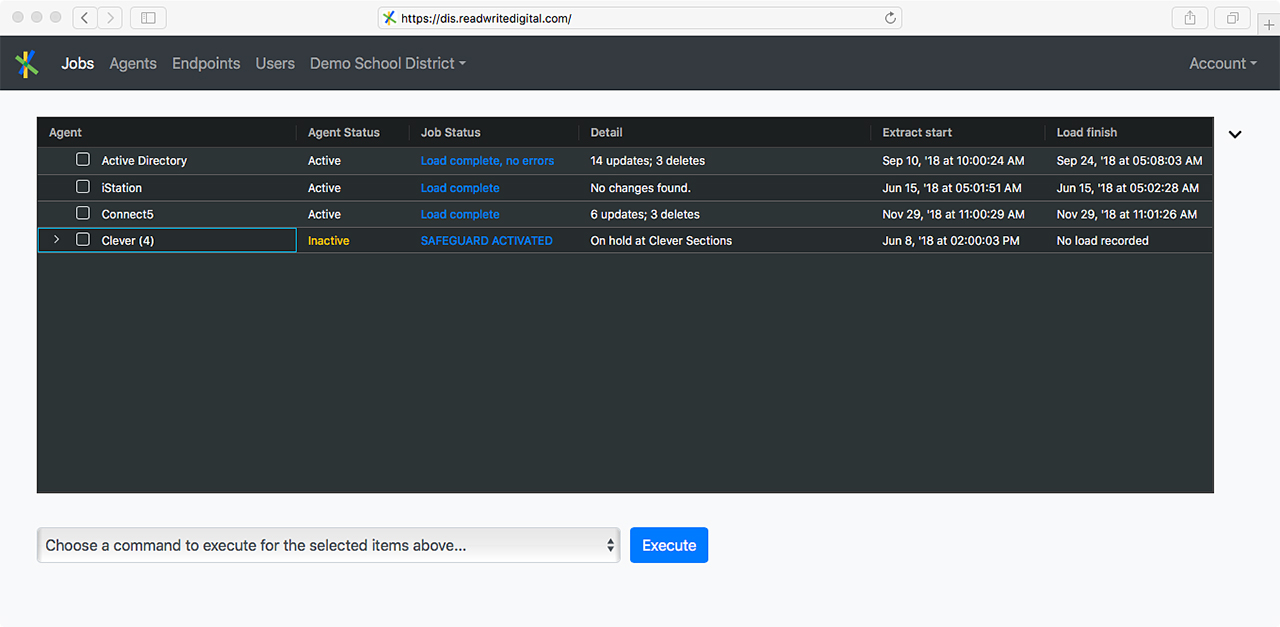
2. Each row in the table represents an agent with it’s latest job status. Clicking on the blue text in the “Job Status” column will first display all of the data extracted and transformed for the job like the following example:
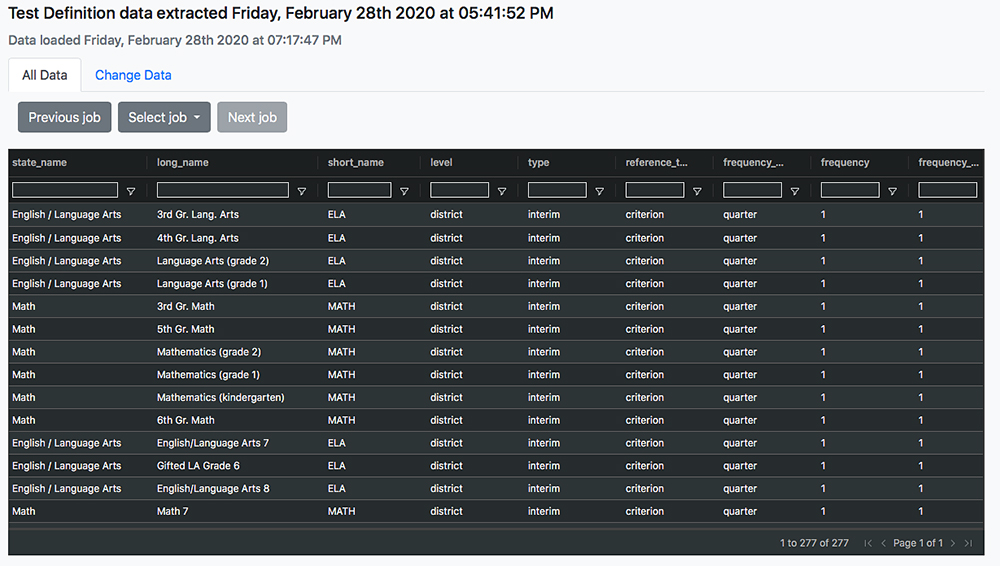
3. Let’s say (using the above screenshot) you want to see data where the short_name of the data includes the text “ela”. To do this, you’ll add a filter. To filter the table on short_name = “ela”, you can click in the text entry field under the short_name column header and type “ela” and the list will instantly filter like:
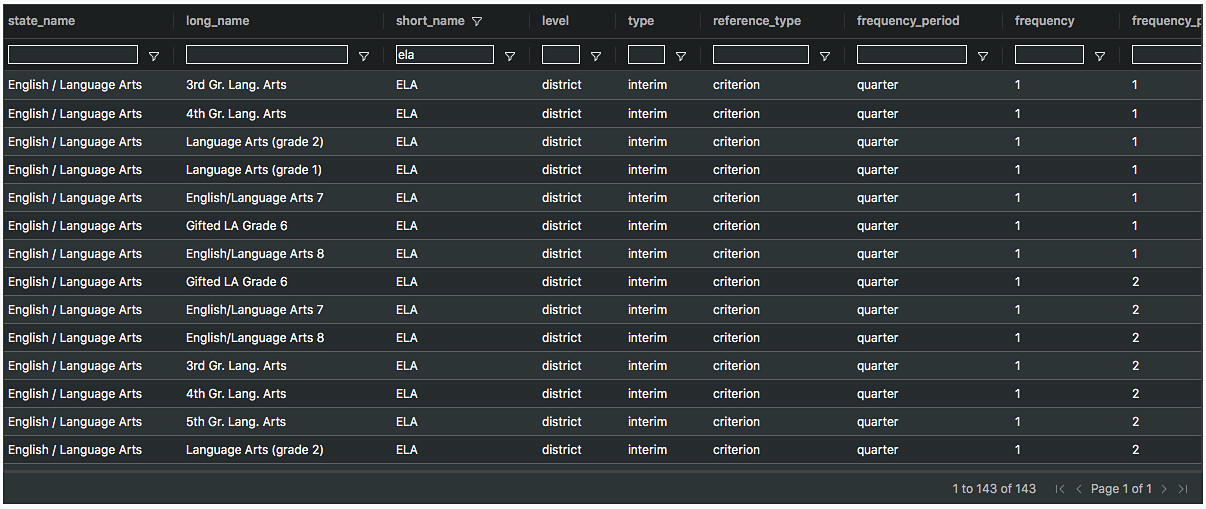
4. Deleting “ela” will bring back all the data again. You can filter like this on one or many columns in the job data view at the same time so you can narrow down to only the data you are interested in. By default a filter executes a “Contains” search meaning Integrator will return any row for where that column contains the text you are filtering on – casting the widest net by default.
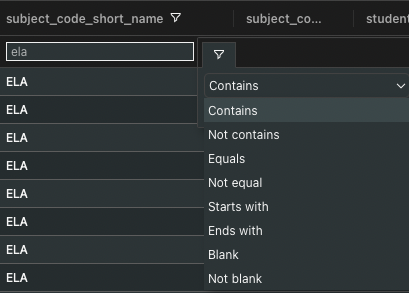
You can get more specific by clicking on the filter button in the column header ![]() and select one of the filter “qualifiers” if you don’t want the default “Contains” search.
and select one of the filter “qualifiers” if you don’t want the default “Contains” search.
Here is an example of directing Integrator to filter for only those rows where the short_name Equals “ela” as opposed to simply containing that text.
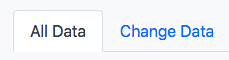
5. In many cases, you will be most interested in the changed data so you’ll want to click on the “Change Data” tab.
The main differences between All Data and Change Data are:
- Change data only shows those records added, updated or deleted as part of the job.
- Three columns at the start of each row in “Change Data” provide the following metadata about the row data:
- Change: Will be tagged as an “add”, “update” or “delete”
- Status: What is the load status of the record?
- Message: What messages came back from the load operation, if any?
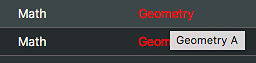
For “update” records in “Change Data”, the specific data that changed will be colored in red font and if you hover your mouse over the red data, you will see the previous value.
Complex agents: parent / child relationships
Looking at the screenshot of the Jobs dashboard again you’ll see the fourth agent listed has “Clever (4)” in the agent name column.

A few things to notice:
- The first 3 agents (Active Directory, iStation and Connect5) are all simple agents with no “child” agents.
- You can deduce the fourth agent (Clever) is a complex agent with “child” agents based on 2 visual cues: the chevron to the left of it’s checkbox and the “(4)” after the agent name indicating there are 4 child agents as “children” of the parent.
If you click on the chevron for a complex agent, you will see something like the following:
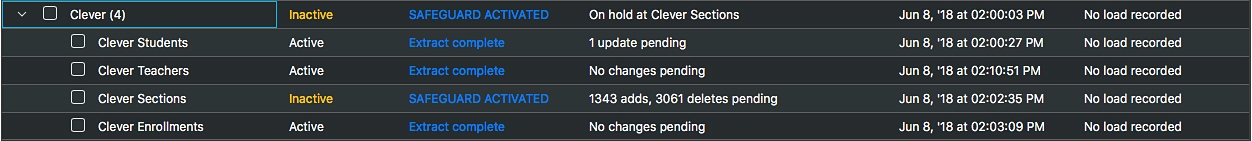
Here the “Parent” agent is “Clever” and it’s children are “Clever Students”, “Clever Teachers” and so forth. In the “Job Status” column this agent indicates “SAFEGUARD ACTIVATED” for the Parent and one child, “Clever Sections” … and you can see why!
![]()
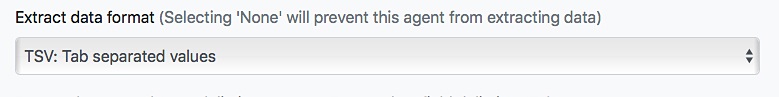
Each child has different data and clicking on its link under “Job Status” allows you to see the data for that particular child. While the parent agent will have a status indicated, the parent often has no data associated with it specifically so clicking on it’s link may show you an empty data grid. Essentially, an agent will only have data if it is configured (under “Agents”) such that the “Extract data format” setting is not “None…” or “Compression archive…”.
Child agents will often be related via common key such as an ID value present in more than 1 agent. Sometimes you’ll want to open the data for the child agents in separate windows so you can filter and look at related data all at once.
Complex agents work best when their jobs are executed at the parent level. On the “Jobs” dashboard, If you see child jobs with extract start times “out of sync” with the parent extract start time – a child started before the parent or way after all other children and the parent – you are probably dealing with an “out of sync” job. This can sometimes happen if a user manually starts or rolls back a child job specifically, instead of doing it at the parent level. As a rule of thumb, users should always “Execute” manual commands on a complex job at the parent level unless they have a good reason not to. For out of sync jobs, it may be difficult to come to very certain conclusions about the overall job during your data analysis.
The big picture: looking at data change rates over time
The “Jobs” dashboard includes a graph of data changes over time. Which you can see by clicking on the chevron located in the top right corner of the page ![]() next to the job list and just under the “Account” menu item.
next to the job list and just under the “Account” menu item.
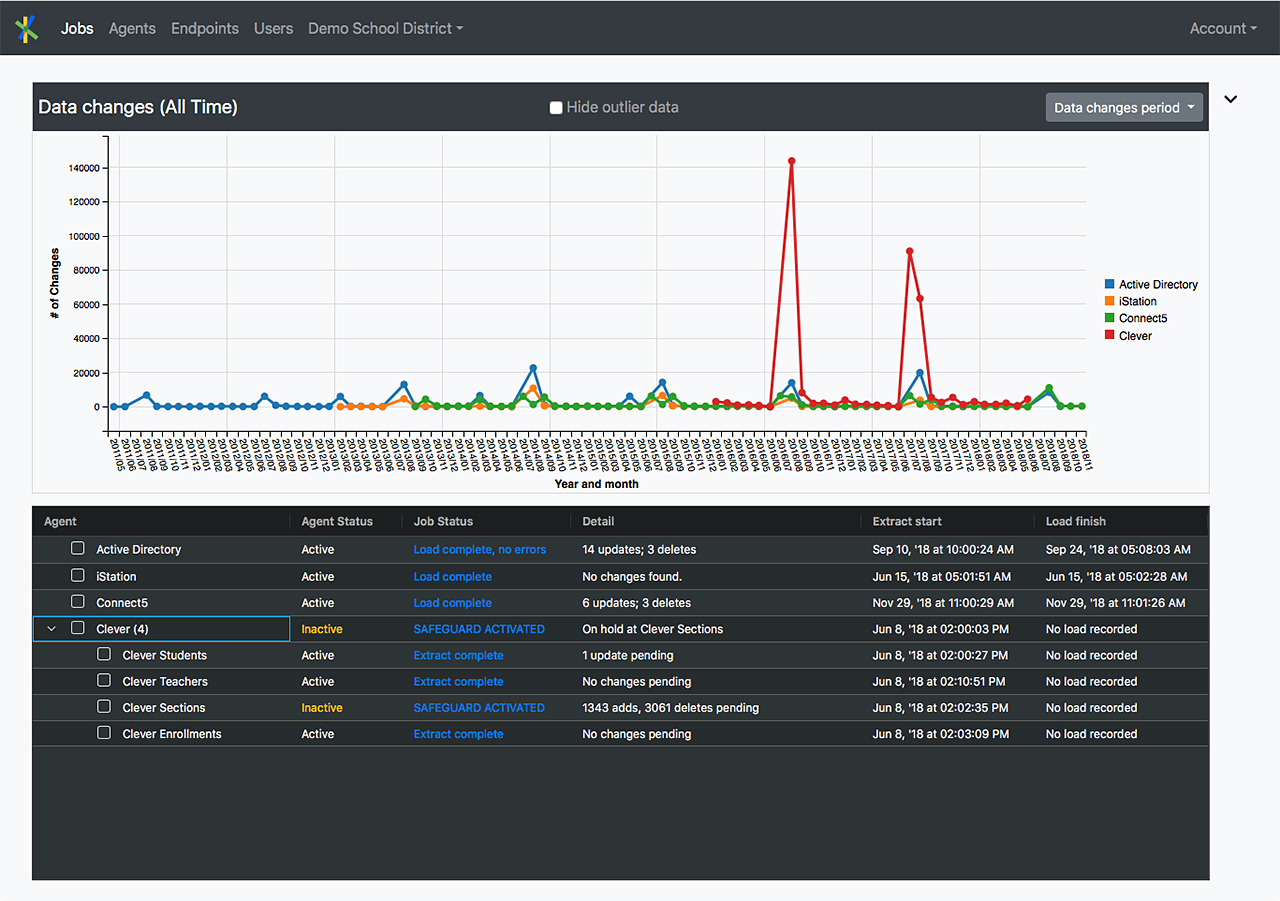
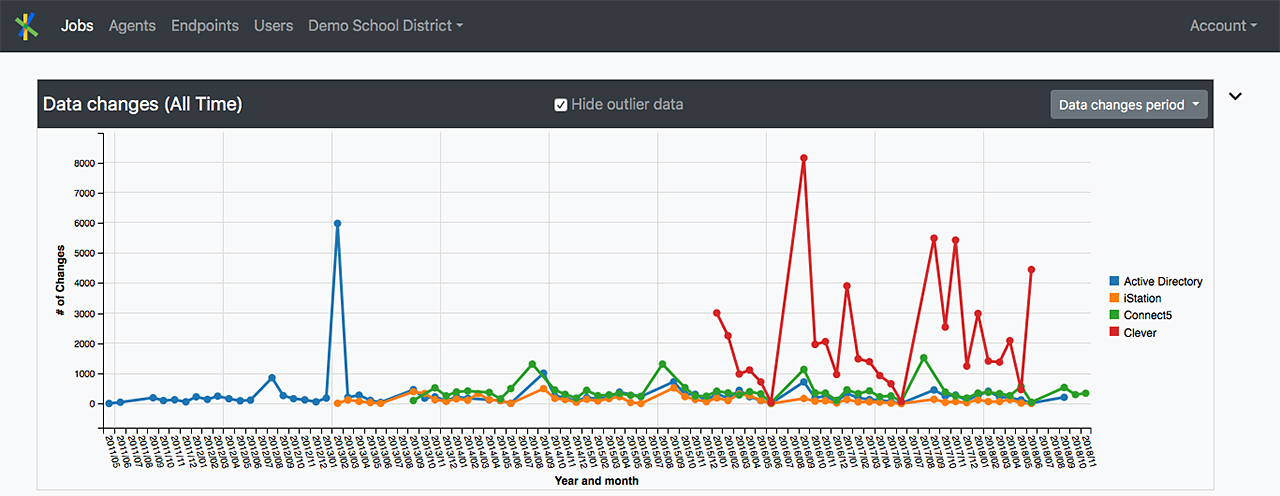
In the example above, the “Data changes period” menu is set to “All Time” selected but we see the change data looks really flat for most of the jobs because we have some huge spikes in the Clever change data. Often that sort of change can be traced to year end transitions or even manual manipulations of the job that artificially caused a spike in changes for a job or two. Clicking the “Hide outlier data” checkbox at the top of the chart will rationalize the data bit.
If we are really just interested in the activity of one agent, click the agent names in the legend on the right until the one you want shows up. Hovering over the graph indicates specific change counts for specific timeframes. Like the example below.
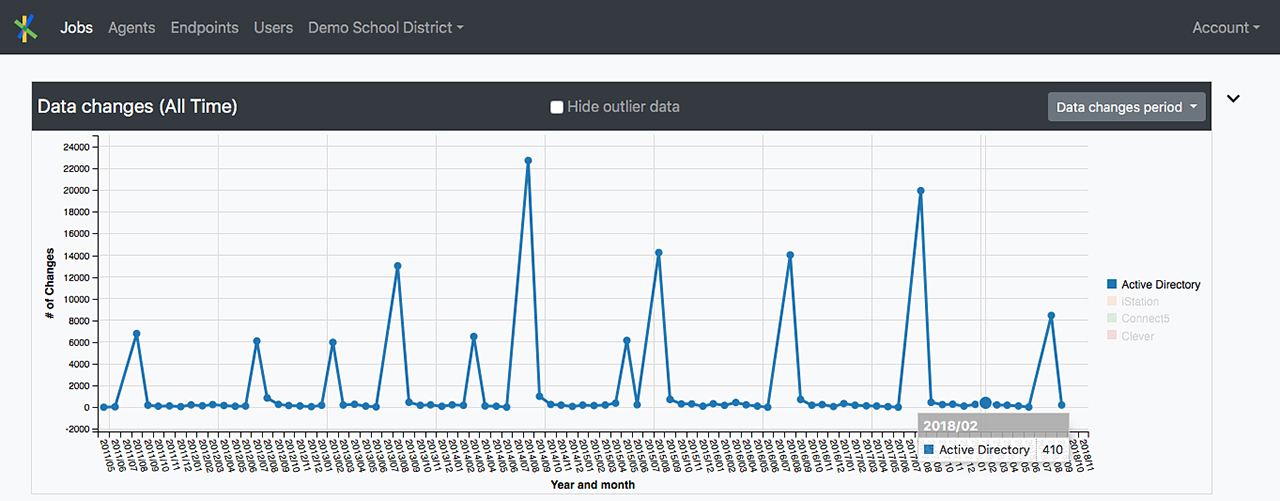
This graph can give you a sense as to the level of changes an agent has over time, what are the busy times, and, in some cases may also provide some idea of how much the app is utilized within your organization.
That’s a wrap
Hopefully, this post has provided you with a sense of how Integrator helps you analyze your data at many levels of granularity and detail. Of course, feel free to reach out to our support team or your account manager if you have more questions or feedback.
Now, go explore your data!